Salary Dashboard
The Challenge
A hands-on project from Luke Barousse's Excel for Data Analytics course. The dataset contains real-world data science job listings from 2023, with job titles, countries, salary figures, and work types.
The objective: build an interactive dashboard that answers one clear question — what salary can a data professional expect, depending on their role, location, and work arrangement?
The Solution
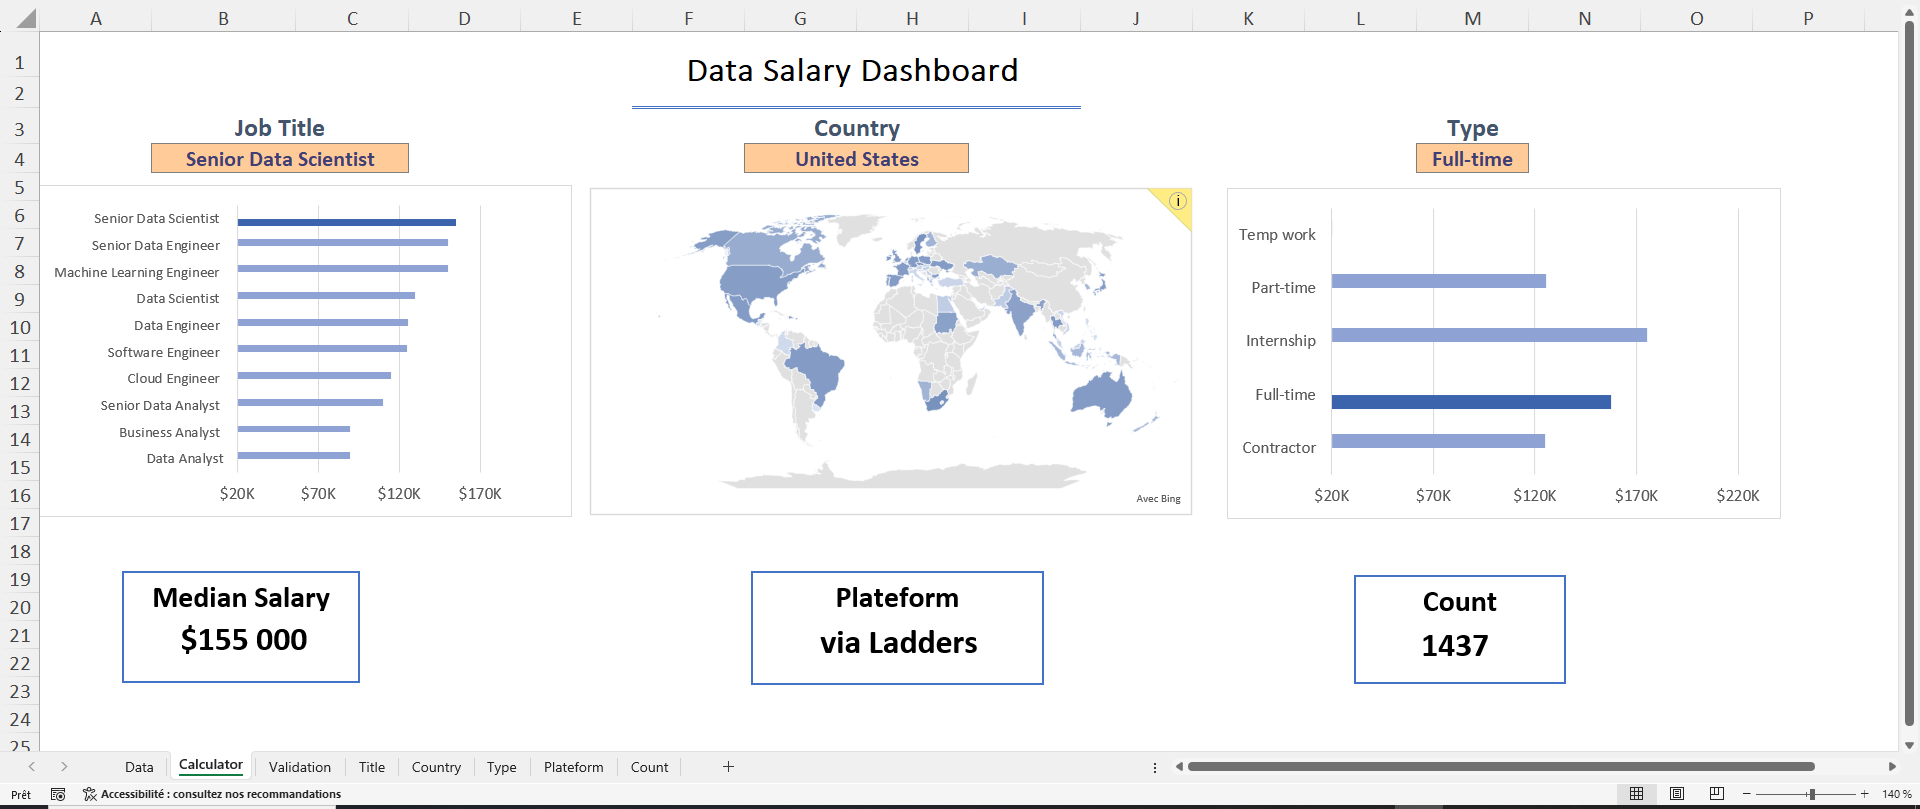
Built a complete interactive Excel dashboard using the course dataset:
- Dynamic Formulas: MEDIAN with nested IF logic (array formulas) to calculate median salary based on the selected job title, country, and work type.
- Data Validation: Dropdown lists for job title, country, and work type filter the dashboard in real-time with validated inputs only.
- Map Chart: Visual salary distribution across countries with color gradients to highlight high and low-paying regions at a glance.
- Bar Chart: Horizontal ranking of median salaries by job title for quick comparison across data roles.
The Impact
Demo
Gallery
Quality Assurance System
The Challenge
In a call center, the line between a "good conversation" and a real commercial performance is often entirely subjective. Without a structured framework, evaluating an agent's quality depended on personal judgement, not measurable facts.
The team had no common reference point to assess interactions, no consistent scoring, and no structured way to give sales reps clear, actionable feedback.
The Solution
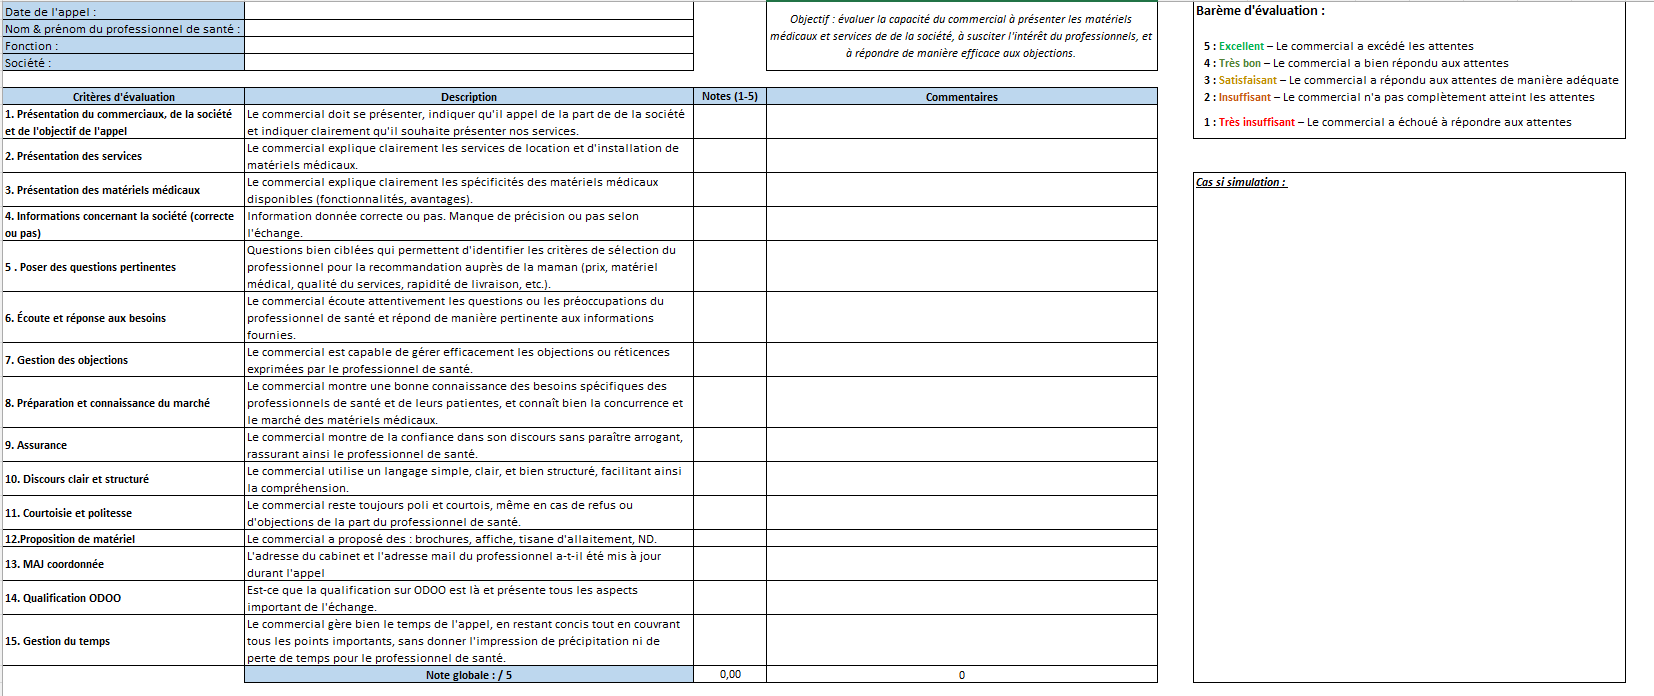
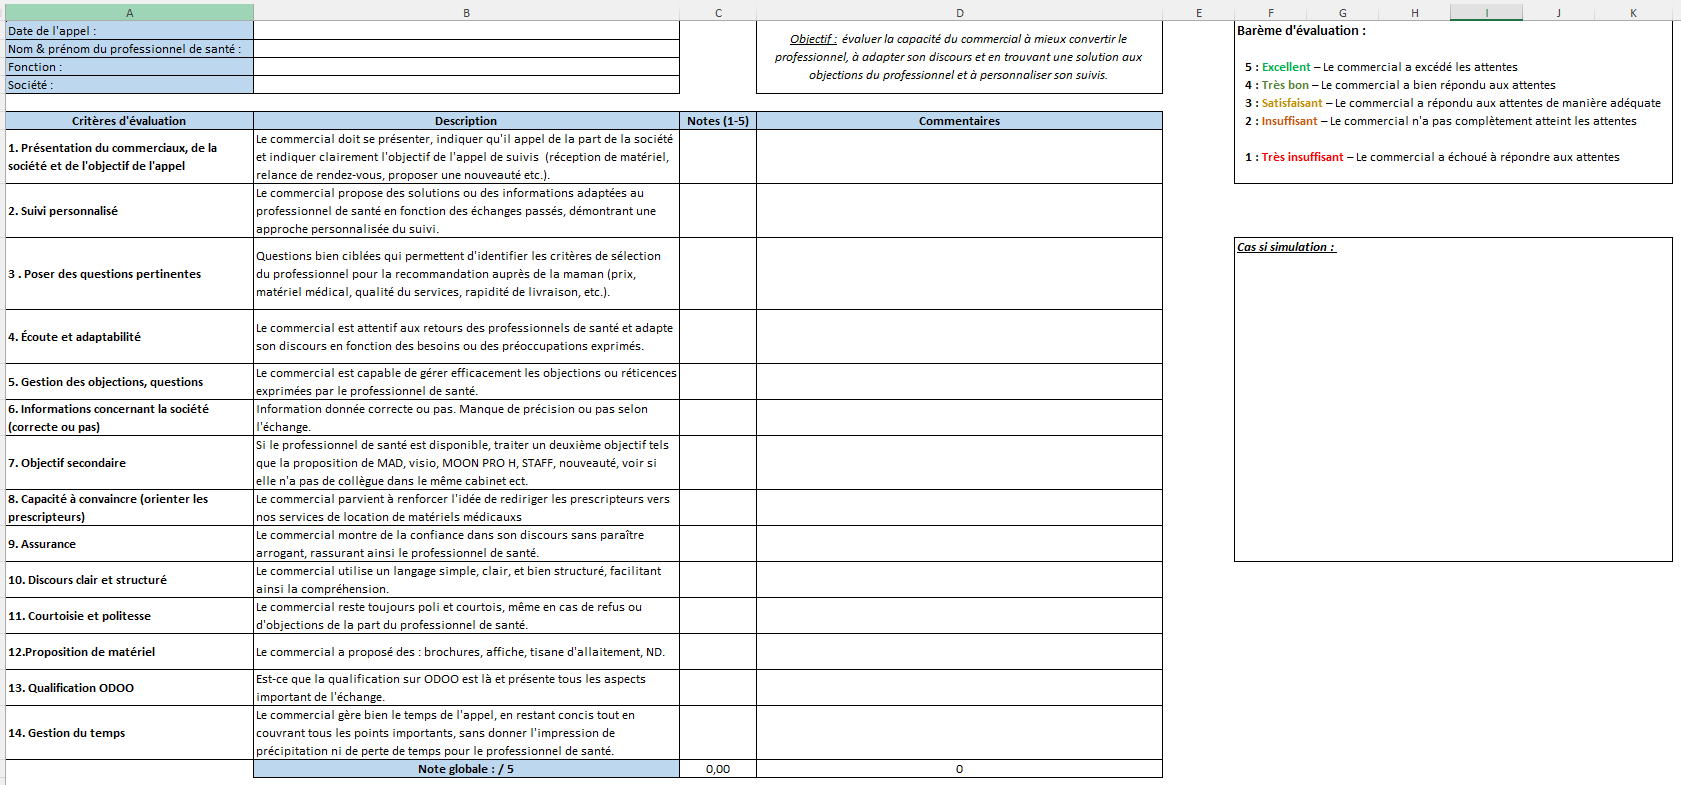
I designed and deployed a Quality Grid system covering two distinct channels:
- Dual-Channel Coverage: Two separate evaluation grids built from scratch, one for phone calls and one for video conferences, each adapted to its specific interaction dynamics.
- Critical KPI Identification: Defined the key criteria that distinguish a quality interaction from a poor one, turning a subjective judgment into a scored checklist.
- Automated Scoring: Advanced Excel formulas calculate scores automatically from the evaluator's inputs, removing manual calculation errors and saving time.
- Structured Feedback: Each evaluated interaction produces a clear, constructive output that gives sales reps precise points to improve.
The Impact
Gallery